By Nikki Johnson, Regional Economist
The United States is in the midst of a significant demographic shift as the population is becoming increasingly more diverse. In 2020, Hispanic and non-white residents represented 42.2% of the nation’s total population, up from 36.3% in 2010 and 30.5% in 2000. This growing diversity is most evident in the nation’s largest metropolitan areas, including Hampton Roads, where Hispanic and non-white residents have become the majority. Across metro areas with more than one million residents, Hispanic and non-white populations accounted for over half (50.3%) of the total population in 2020.
Major metropolitan areas have long been hubs for minority populations, shaped by the early waves of immigration and the Great Migration of Black Americans to northern cities. In 2020, 20 of the 56 largest metros were majority-minority, up from nine in 2000. From 2010 to 2020, the white population declined nationwide, a trend that is expected to continue as birth rates decline and deaths rise due to an aging population. Over the same period, Hispanic and Asian Americans were the fastest growing racial and ethnic groups.
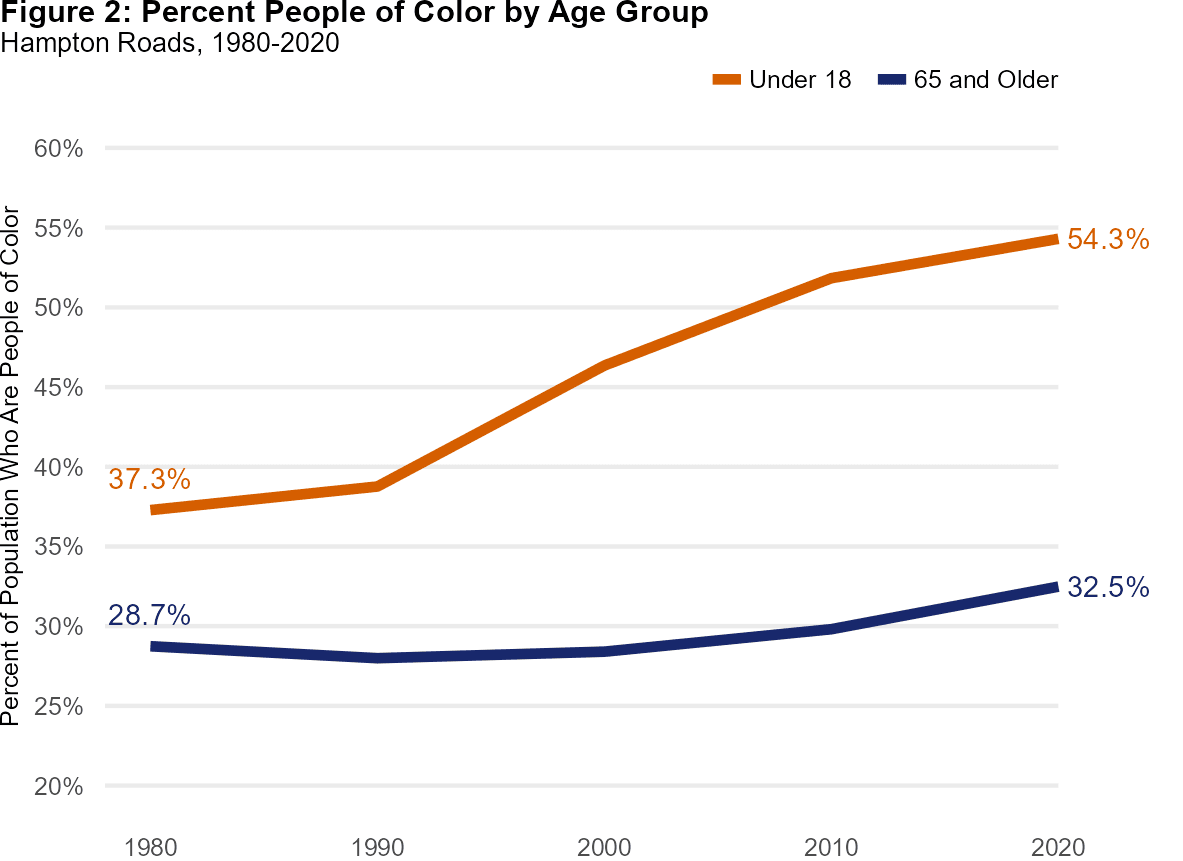
Figure 1 shows each racial and ethnic group’s share of the Hampton Roads population between 1980 and 2020. Since the turn of the century, the share of non-Hispanic white residents decreased from 61.1% in 2000 to 52.1% in 2020. Over the same period, the region’s share of residents who identify as Black slightly decreased. In 2020, Hispanic and non-white residents accounted for 47.9% of the population, up from 31.6% in 1980. In the most recent 2010s decade, the most significant gains were among residents of mixed and other race, whose share more than doubled from 3.0% in 2010 to 6.1% in 2020. A critical aspect of this demographic shift is the growing racial generation gap, where younger populations are more diverse than older ones.
In 1980, Hispanic and non-white residents made up 37.3% of the youth population and 28.7% of the region’s senior population, a racial generation gap of 8.6 percentage points (Figure 2). By 2020, the gap had increased to 21.8 percentage points.
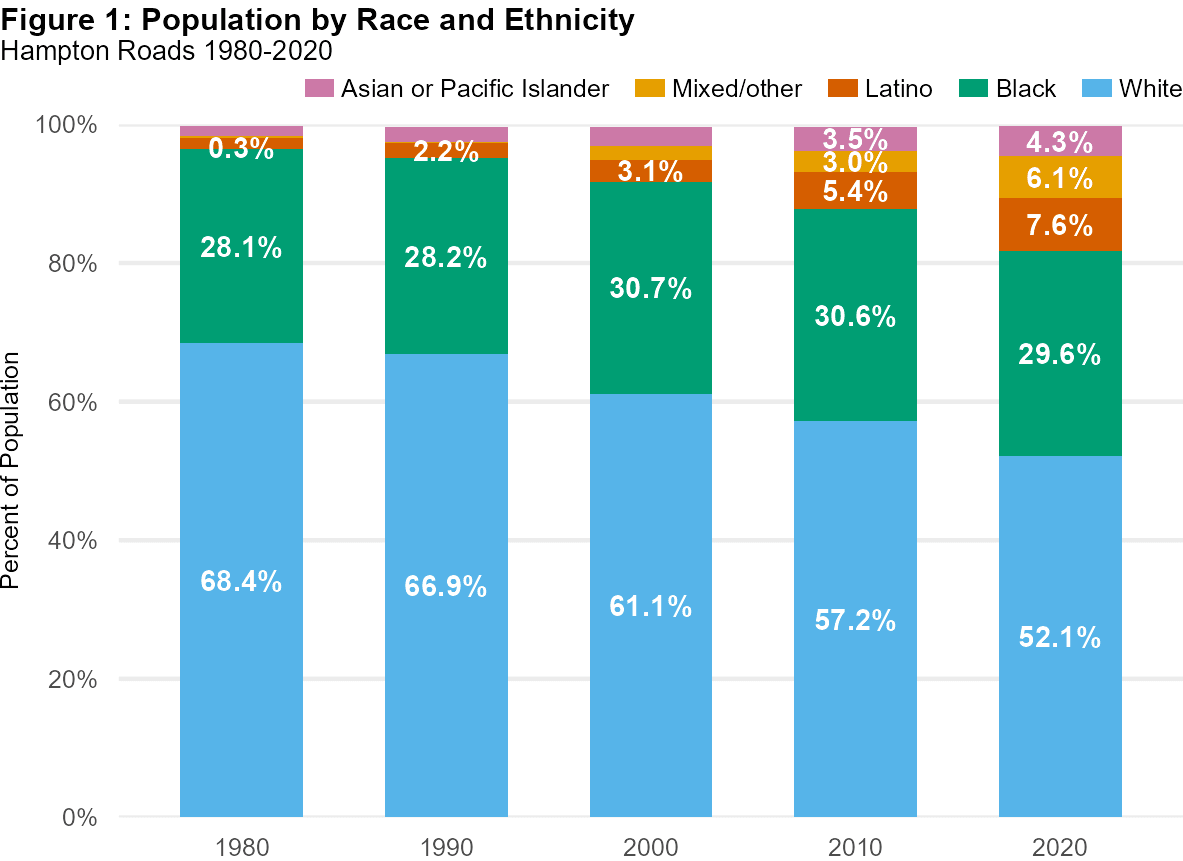 |  |
| Data source: U.S. Census Bureau | National Equity Atlas and HRPDC. *Latino includes respondents of any race. All race categories are respondents of non-Hispanic origin. |
The rising diversity among the nation’s future workforce highlights the increasing importance of strategies to reduce persistent disparities. Reducing disparities that limit an individual’s ability to reach their full economic potential can lead to more widespread economic gains.
Read the rest below or by downloading the PDF.